usbynumbers

Cleanest Countries by Air Quality

· by numbers

Measured by the air people actually breathe (fine-particle pollution, PM2.5), the cleanest air on Earth is in small, remote places: Greenland tops the list at 1.64 µg/m³. Among larger countries, Finland and the Nordics lead, at about 4.6 µg/m³. The world average is 32.9 µg/m³, over 6.6× the level the WHO calls safe.

World average PM2.5
32.9
µg/m³ · 2023
Cleanest air
1.6
Greenland
Cleanest major country
4.6
4.6 µg/m³ · rank #8
Where the air is cleanest
200 economies · … mapped
Loading map…
Color = PM2.5 (darker means cleaner air). Hover any country for its exact figure.
source: World Bank WDIdata year: 2023geo: 200 economieslower PM2.5 = cleaner air
About this data
method: PM2.5 mean annual exposure, µg/m³, from World Bank (EN.ATM.PM25.MC.M3); lower = cleaner
page updated: 2026-07-20
This ranking measures ONE thing: PM2.5 — fine airborne particles smaller than 2.5 microns, the pollutant most closely tied to premature death. It is a strong, well-sourced proxy for AIR QUALITY, but it is not a measure of overall environmental health. A country can have clean air and still struggle with water, waste, biodiversity or emissions — and vice versa. Read this as "cleanest air", not "greenest country".
The very cleanest places are small islands and sparsely populated territories — Greenland, Pacific islands, the Arctic — where there is little industry, traffic or dust and the wind clears the air. That is why the top of the list is not full of famous "green" nations. Among larger, more populated countries, Finland, Sweden, Norway and other northern nations consistently have the cleanest air.
The World Health Organization recommends annual PM2.5 stay at or below 5 µg/m³. Only a handful of economies meet it; the global population-weighted average is around 32.9 µg/m³. We show that guideline on the chart below as an honest yardstick.
For a broader environmental picture — water, biodiversity, climate policy and more — see Yale's Environmental Performance Index (EPI). It uses a different, composite methodology; we link to it rather than reproduce its scores.
License: CC BY 4.0 (World Bank Open Data). PM2.5 estimates originate from the Global Burden of Disease study.

Air quality by country

Pick any country to see its PM2.5 level, its clean-air rank, and how it compares to the world average and the WHO safe limit.

Choose a country above to see how clean its air is — and where it sits in the world.

e.g. Czechia — 12.8 µg/m³ · #65 of 200

Top 10 countries with the cleanest air

The ten economies with the lowest PM2.5. Longer bar = cleaner air. Most are small islands or remote territories — the honest picture of where fine-particle pollution is lowest.

Show
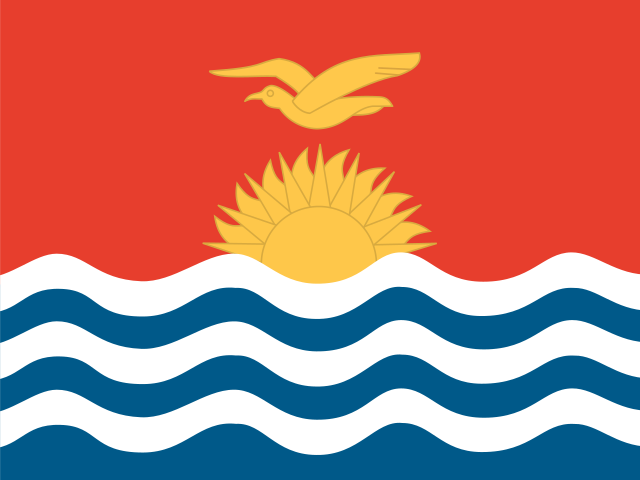
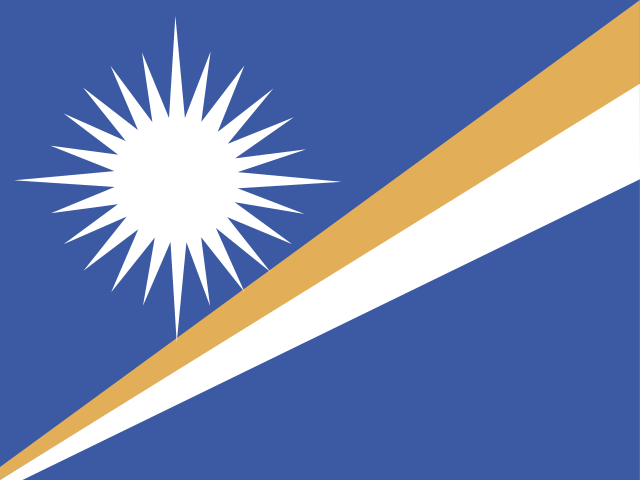
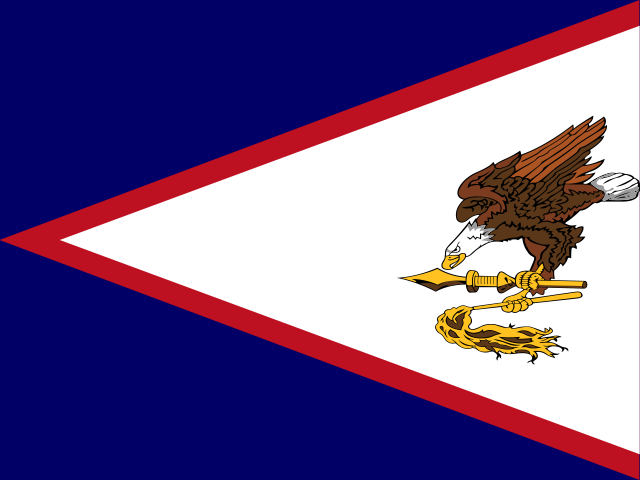
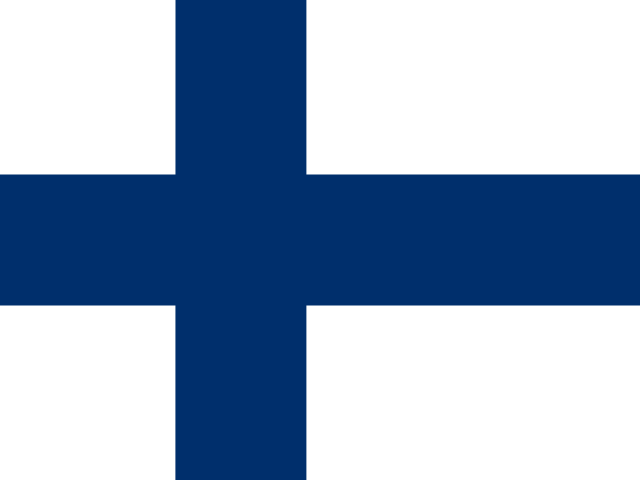
1. Greenland1.62. Northern Mariana Islands2.73. Guam3.54. Micronesia3.55. Kiribati3.96. Marshall Islands4.17. American Samoa4.38. Finland4.69. Samoa4.610. Bermuda4.6

Every economy in the world, ranked

The full list — sort by any column. Search to jump to a country. The PM2.5 column is colored by a continuous ramp: darker means cleaner air.

RankCountryPM2.5vs worldChange, yrRegion
1Greenland1.6−31.2−0.1Europe & Central Asia
2Northern Mariana Islands2.7−30.2−0.1East Asia & Pacific
3Guam3.5−29.4−0.3East Asia & Pacific
4Micronesia3.5−29.4−0.5East Asia & Pacific
5Kiribati3.9−29.0+0.1East Asia & Pacific
6Marshall Islands4.1−28.8−0.7East Asia & Pacific
7American Samoa4.3−28.6−0.6East Asia & Pacific
8Finland4.6−28.3−0.6Europe & Central Asia
9Samoa4.6−28.3−0.8East Asia & Pacific
10Bermuda4.6−28.2−0.0North America
11Tonga4.7−28.2−0.6East Asia & Pacific
12Naoero4.8−28.0+0.5East Asia & Pacific
13Iceland4.9−27.9+0.1Europe & Central Asia
14Palau4.9−27.9−0.3East Asia & Pacific
15Tuvalu5.2−27.6−0.2East Asia & Pacific
16Sweden5.3−27.6−0.4Europe & Central Asia
17Bahamas5.3−27.6+0.1Latin America & Caribbean
18Norway5.5−27.4−0.5Europe & Central Asia
19Estonia5.9−26.9−0.7Europe & Central Asia
20Australia6.4−26.5+1.1East Asia & Pacific
21Fiji6.5−26.4−0.9East Asia & Pacific
22Canada6.5−26.3+0.2North America
23U.S. Virgin Islands6.8−26.1+1.1Latin America & Caribbean
24New Zealand6.9−26.0−0.1East Asia & Pacific
25United States7.0−25.9−0.5North America
26Vanuatu7.0−25.9−0.3East Asia & Pacific
27Luxembourg7.4−25.4−1.6Europe & Central Asia
28Denmark7.5−25.4−0.7Europe & Central Asia
29Ireland7.5−25.4−0.6Europe & Central Asia
30Brunei7.6−25.3+0.1East Asia & Pacific
31Puerto Rico (US)7.8−25.0+1.5Latin America & Caribbean
32France8.2−24.6−2.2Europe & Central Asia
33Switzerland8.3−24.6−1.9Europe & Central Asia
34Antigua and Barbuda8.4−24.5+0.5Latin America & Caribbean
35Belgium8.4−24.4−1.6Europe & Central Asia
36Netherlands8.6−24.3−1.1Europe & Central Asia
37Portugal8.8−24.1−0.5Europe & Central Asia
38Germany8.8−24.1−0.8Europe & Central Asia
39St. Kitts and Nevis8.9−24.0+0.6Latin America & Caribbean
40Andorra8.9−24.0−2.6Europe & Central Asia
41Seychelles9.3−23.6−0.4Sub-Saharan Africa
42Cuba9.4−23.4+0.0Latin America & Caribbean
43United Kingdom9.5−23.4−0.6Europe & Central Asia
44Solomon Islands9.8−23.1−0.1East Asia & Pacific
45Austria10.0−22.8−0.6Europe & Central Asia
46Spain10.1−22.8−1.9Europe & Central Asia
47Comoros10.2−22.7−1.9Sub-Saharan Africa
48St. Lucia10.4−22.4−0.1Latin America & Caribbean
49St. Vincent and the Grenadines10.6−22.3−0.1Latin America & Caribbean
50Lithuania10.8−22.1−0.3Europe & Central Asia
51Malta10.8−22.1−0.8Middle East, North Africa, Afghanistan & Pakistan
52Uruguay10.8−22.0−0.9Latin America & Caribbean
53Barbados10.9−22.0+0.1Latin America & Caribbean
54Grenada11.0−21.8+0.0Latin America & Caribbean
55Maldives11.2−21.7+0.8South Asia
56Monaco11.4−21.5−1.5Europe & Central Asia
57Japan11.4−21.4−1.0East Asia & Pacific
58Dominica11.5−21.4+0.4Latin America & Caribbean
59Russia11.6−21.3−0.2Europe & Central Asia
60Belarus12.0−20.9+0.6Europe & Central Asia
61Timor-Leste12.0−20.9−0.7East Asia & Pacific
62Madagascar12.4−20.5−1.3Sub-Saharan Africa
63Slovenia12.6−20.3−1.1Europe & Central Asia
64San Marino12.7−20.1−4.0Europe & Central Asia
65Czechia12.8−20.1−0.1Europe & Central Asia
66Latvia13.0−19.9−0.9Europe & Central Asia
67Botswana13.2−19.6−0.1Sub-Saharan Africa
68Brazil13.4−19.5−1.6Latin America & Caribbean
69Dominican Republic13.5−19.4+0.7Latin America & Caribbean
70Hungary13.7−19.2−0.3Europe & Central Asia
71Slovakia13.7−19.2−0.0Europe & Central Asia
72Mozambique13.7−19.1−2.3Sub-Saharan Africa
73Trinidad and Tobago13.8−19.1−0.7Latin America & Caribbean
74Mauritius14.1−18.8−1.0Sub-Saharan Africa
75Papua New Guinea14.1−18.8−2.0East Asia & Pacific
76Greece14.1−18.8−2.2Europe & Central Asia
77Namibia14.2−18.6−2.5Sub-Saharan Africa
78Italy14.3−18.6−1.9Europe & Central Asia
79Argentina14.3−18.5−1.5Latin America & Caribbean
80Ukraine14.8−18.0+0.8Europe & Central Asia
81Moldova14.9−17.9+0.4Europe & Central Asia
82Zimbabwe15.0−17.9−2.4Sub-Saharan Africa
83Sao Tome and Principe15.1−17.8+0.1Sub-Saharan Africa
84Panama15.1−17.8−0.1Latin America & Caribbean
85Singapore15.1−17.7+0.1East Asia & Pacific
86Paraguay15.3−17.5+0.9Latin America & Caribbean
87Albania15.5−17.4−0.9Europe & Central Asia
88Suriname15.7−17.2−0.4Latin America & Caribbean
89Croatia15.8−17.1−1.1Europe & Central Asia
90Haiti15.8−17.1+1.2Latin America & Caribbean
91Malaysia15.9−17.0+0.5East Asia & Pacific
92Romania16.0−16.9−0.4Europe & Central Asia
93Cyprus16.1−16.8−5.3Europe & Central Asia
94Poland16.5−16.4+0.6Europe & Central Asia
95Algeria16.5−16.3−2.6Middle East, North Africa, Afghanistan & Pakistan
96Mexico16.6−16.3−0.0Latin America & Caribbean
97Malawi16.7−16.1−3.4Sub-Saharan Africa
98Eswatini16.8−16.1−1.7Sub-Saharan Africa
99Belize16.8−16.1+0.7Latin America & Caribbean
100Guyana16.9−15.9−0.6Latin America & Caribbean
101Costa Rica17.7−15.2−0.5Latin America & Caribbean
102Liberia17.9−14.9−0.1Sub-Saharan Africa
103Colombia18.4−14.5−0.5Latin America & Caribbean
104Montenegro18.4−14.4−0.2Europe & Central Asia
105Somalia, Fed. Rep.18.5−14.3−1.5Sub-Saharan Africa
106Georgia18.6−14.3−0.8Europe & Central Asia
107Ecuador18.6−14.3−1.2Latin America & Caribbean
108Morocco18.7−14.2−2.6Middle East, North Africa, Afghanistan & Pakistan
109Tunisia18.9−14.0−3.5Middle East, North Africa, Afghanistan & Pakistan
110Venezuela19.2−13.7+0.4Latin America & Caribbean
111Serbia19.3−13.5−0.2Europe & Central Asia
112Cambodia19.4−13.4−0.4East Asia & Pacific
113Kazakhstan19.6−13.3+0.6Europe & Central Asia
114Bulgaria19.7−13.2−3.1Europe & Central Asia
115Angola19.9−13.0−2.6Sub-Saharan Africa
116Libya20.0−12.9−3.2Middle East, North Africa, Afghanistan & Pakistan
117Kyrgyzstan20.1−12.8+1.4Europe & Central Asia
118Tanzania20.2−12.7−1.7Sub-Saharan Africa
119Cabo Verde20.2−12.7+1.9Sub-Saharan Africa
120Zambia20.2−12.6−3.3Sub-Saharan Africa
121Kenya20.3−12.6−0.5Sub-Saharan Africa
122Cote d'Ivoire20.4−12.5−1.4Sub-Saharan Africa
123Nicaragua20.4−12.4−0.4Latin America & Caribbean
124Indonesia20.8−12.0+1.1East Asia & Pacific
125Jamaica21.6−11.2+0.8Latin America & Caribbean
126North Korea21.8−11.1+0.9East Asia & Pacific
127North Macedonia21.8−11.1−0.7Europe & Central Asia
128South Korea21.9−11.0−1.6East Asia & Pacific
129Israel21.9−11.0−1.2Middle East, North Africa, Afghanistan & Pakistan
130Philippines22.2−10.7−2.0East Asia & Pacific
131West Bank and Gaza22.4−10.5−1.3Middle East, North Africa, Afghanistan & Pakistan
132Sierra Leone22.5−10.4+0.1Sub-Saharan Africa
133Sri Lanka22.7−10.2−1.4South Asia
134Chile23.1−9.8−6.1Latin America & Caribbean
135Thailand23.5−9.4−0.2East Asia & Pacific
136South Sudan23.7−9.2−0.6Sub-Saharan Africa
137Azerbaijan23.7−9.2−0.5Europe & Central Asia
138Ethiopia23.8−9.1+0.3Sub-Saharan Africa
139Vietnam24.8−8.1−0.7East Asia & Pacific
140Laos26.0−6.9+0.6East Asia & Pacific
141Bosnia and Herzegovina26.1−6.8−1.0Europe & Central Asia
142Türkiye26.4−6.5−1.3Europe & Central Asia
143Lesotho26.4−6.4−4.3Sub-Saharan Africa
144Lebanon26.7−6.2−1.3Middle East, North Africa, Afghanistan & Pakistan
145Guinea27.3−5.6−0.3Sub-Saharan Africa
146South Africa27.7−5.2−0.8Sub-Saharan Africa
147Bolivia28.1−4.7−2.4Latin America & Caribbean
148Ghana28.1−4.7−1.9Sub-Saharan Africa
149Armenia28.6−4.3−0.8Europe & Central Asia
150El Salvador29.6−3.3−0.2Latin America & Caribbean
151Guatemala29.7−3.2+1.4Latin America & Caribbean
152Bhutan30.1−2.8+4.4South Asia
153Honduras30.7−2.1+1.1Latin America & Caribbean
154Peru31.1−1.8−1.4Latin America & Caribbean
155Uganda31.2−1.7−0.7Sub-Saharan Africa
156Turkmenistan31.3−1.6−2.1Europe & Central Asia
157Gabon31.3−1.6−0.9Sub-Saharan Africa
158China32.0−0.9+0.1East Asia & Pacific
159Syria32.1−0.8−3.3Middle East, North Africa, Afghanistan & Pakistan
160Guinea-Bissau32.3−0.6+0.7Sub-Saharan Africa
161Jordan32.6−0.2−0.7Middle East, North Africa, Afghanistan & Pakistan
162Uzbekistan32.8−0.1−0.1Europe & Central Asia
163Central African Republic33.3+0.4+0.7Sub-Saharan Africa
164Tajikistan33.4+0.5−1.0Europe & Central Asia
165Eritrea33.7+0.8+0.5Sub-Saharan Africa
166Togo34.3+1.5−1.5Sub-Saharan Africa
167Myanmar35.1+2.2+2.2East Asia & Pacific
168Mali35.5+2.6−1.8Sub-Saharan Africa
169Burundi35.7+2.8−0.6Sub-Saharan Africa
170DR Congo35.8+2.9−1.0Sub-Saharan Africa
171Rwanda36.0+3.1−0.1Sub-Saharan Africa
172Congo36.5+3.7−1.0Sub-Saharan Africa
173Burkina Faso37.3+4.5−4.2Sub-Saharan Africa
174Sudan37.6+4.7−1.4Sub-Saharan Africa
175Afghanistan38.0+5.1−2.3Middle East, North Africa, Afghanistan & Pakistan
176Gambia38.3+5.4+2.1Sub-Saharan Africa
177Benin39.7+6.8−1.8Sub-Saharan Africa
178Iran40.3+7.4−3.6Middle East, North Africa, Afghanistan & Pakistan
179Djibouti40.3+7.4+1.3Middle East, North Africa, Afghanistan & Pakistan
180Senegal41.6+8.8+2.3Sub-Saharan Africa
181Equatorial Guinea42.2+9.3−1.4Sub-Saharan Africa
182Mongolia42.7+9.8+1.8East Asia & Pacific
183Chad43.0+10.1+0.6Sub-Saharan Africa
184Egypt43.1+10.3+0.9Middle East, North Africa, Afghanistan & Pakistan
185Mauritania46.5+13.6+1.5Sub-Saharan Africa
186Yemen46.8+14.0−0.3Middle East, North Africa, Afghanistan & Pakistan
187Oman46.9+14.0−5.3Middle East, North Africa, Afghanistan & Pakistan
188Iraq49.5+16.6−10.1Middle East, North Africa, Afghanistan & Pakistan
189Nepal53.2+20.3+2.6South Asia
190India54.0+21.2+3.4South Asia
191Cameroon55.6+22.7−1.0Sub-Saharan Africa
192Bahrain56.6+23.7−6.1Middle East, North Africa, Afghanistan & Pakistan
193United Arab Emirates57.2+24.3−10.5Middle East, North Africa, Afghanistan & Pakistan
194Pakistan58.4+25.5+0.5Middle East, North Africa, Afghanistan & Pakistan
195Kuwait62.4+29.5−12.2Middle East, North Africa, Afghanistan & Pakistan
196Niger65.2+32.4−9.3Sub-Saharan Africa
197Nigeria65.7+32.9−4.9Sub-Saharan Africa
198Bangladesh69.3+36.4+6.0South Asia
199Saudi Arabia73.5+40.6−4.3Middle East, North Africa, Afghanistan & Pakistan
200Qatar107.8+74.9−4.2Middle East, North Africa, Afghanistan & Pakistan
The complete list: 200 economies with 2023 World Bank PM2.5 data, ranked cleanest first. "vs world" is the gap from the global average; "Change" is vs 2022 — a negative value means the air got cleaner.

Five numbers worth remembering

The same dataset, squeezed into the facts people actually retell.

The cleanest air on Earth — 1.64 µg/m³ in Greenland — is 66× cleaner than the most polluted country
Greenland 1.64 vs Qatar 107.8 µg/m³ · 2023
Among large, populated countries, Finland has the cleanest air — 4.6 µg/m³, world rank #8
The very top of the list is small islands and Arctic territories
Only 14 of 200 economies meet the WHO safe limit of 5 µg/m³
World average 32.9 µg/m³ — over 6.6× the guideline
The most polluted country, Qatar, breathes 107.8 µg/m³ — 21.6× the WHO limit
The Gulf, South Asia and the Sahel carry the heaviest PM2.5 loads
106.1 µg/m³ separates the cleanest air from the most polluted — one of the widest gaps in any global ranking
PM2.5, 2023, 200 economies

What this number really means

World average PM2.5, → 2023 (µg/m³)
010203040201020152020WHO guideline 5 µg/m³32.9
The world's population-weighted PM2.5 has hovered around 32.9 µg/m³ — many times the WHO's recommended 5 µg/m³. Most people on Earth breathe air the WHO considers unsafe; the cleanest countries are the exception, not the rule.

PM2.5 is fine particulate matter — soot, dust and chemical droplets under 2.5 microns across, small enough to lodge deep in the lungs and cross into the blood. It is the single air pollutant most tightly linked to early death from heart disease, stroke, lung cancer and respiratory illness, which is why it, rather than any broader "green" index, is the clearest measure of the air a population actually breathes.

That focus is also this ranking's honest limit. It measures air, not everything. The cleanest scores belong to Greenland and other small, remote or sparsely populated places with little industry or traffic — not because they run the greenest economies, but because there is little to pollute the air and plenty of wind to clear it. Among large, populated nations, the leaders are Finland, Sweden, Norway and other northern countries with cold climates, strong regulation and few dust sources.

And clean air is not the same as a clean environment. A country can have pristine air and heavy carbon emissions, water stress or biodiversity loss — or breathe polluted air while leading on climate policy. Treat this as a precise answer to one important question — "where is the air cleanest?" — not as a verdict on which countries are the most environmentally responsible overall.

Known limitations: PM2.5 exposure is modeled by combining satellite readings, atmospheric models and ground stations, so countries with few monitors carry wider uncertainty; the figure is a national population-weighted average that hides big differences between a smoggy capital and clean countryside; and it captures outdoor air only, not indoor pollution from cooking or heating, which is a major hazard in many lower-income countries. Treat every figure as a well-sourced estimate, not an exact count.

Frequently asked questions

Which country has the cleanest air?
By PM2.5 — the fine-particle pollution most tied to health — Greenland has the cleanest air on record, about 1.64 µg/m³ (2023), according to World Bank data. The very cleanest places are small, remote islands and territories. Among larger, populated countries, Finland and the Nordic nations lead, at around 4.6 µg/m³.
Does this mean these are the cleanest or greenest countries overall?
No — and this is the key caveat. This ranking measures air quality (PM2.5), not overall environmental health. A country can have clean air but high carbon emissions or water stress, and vice versa. For a broader picture that combines water, biodiversity, climate and more, see Yale's Environmental Performance Index (EPI), which uses a different composite method.
What is PM2.5 and why measure it?
PM2.5 is fine particulate matter — airborne particles under 2.5 microns wide, from sources like traffic, industry, wildfires and dust. They are small enough to reach deep into the lungs and bloodstream, making PM2.5 the air pollutant most strongly linked to premature death. It is the clearest single indicator of how clean the air people breathe actually is.
What is a safe level of PM2.5?
The World Health Organization recommends an annual average at or below 5 µg/m³. Only about 14 of the 200 economies here meet that limit; the global population-weighted average is around 32.9 µg/m³, so most people breathe air the WHO considers unsafe.
Which country has the most polluted air?
On this list, Qatar has the highest PM2.5, about 107.8 µg/m³ (2023) — many times the WHO limit. The heaviest particle pollution is concentrated in the Gulf states, South Asia and the Sahel, driven by industry, traffic, crop burning and desert dust.
Why are small islands at the top instead of famous green countries?
Because PM2.5 depends heavily on geography, not just policy. Small, remote or sparsely populated places like Greenland and Pacific islands have little industry or traffic and steady winds that clear the air, so their PM2.5 is naturally very low. Larger green-reputation countries have more people, cars and industry, so their air, while good, isn't the lowest on the planet.
How many countries are in this ranking?
This page ranks 200 economies for which the World Bank reports a 2023 PM2.5 figure — nearly every country and territory, using one consistent source so the ranking is comparable.

More, by numbers

Sources & further reading

Every figure on this page traces back to the same primary dataset, refreshed from the World Bank API.

This Week, By Numbers

One email. A handful of numbers worth knowing. No spam.